- Home
- Research
- Education & Outreach
- Facilities
- Industry
Hysitron Triboindenter
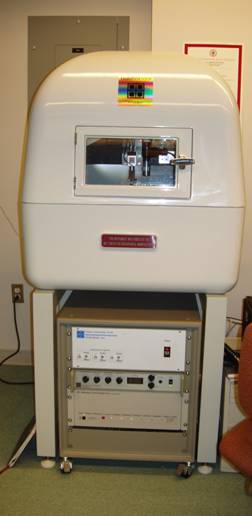 The Hysitron Triboindenter system is a state of the art Nanomechanical Test system purchased very recently with the support of NSF-IGERT and the NSF Center for Hierarchical Manufacturing. The instrument can measure the Hardness and Elastic constants of thin films and coatings using the Quasi static mode of operation. Using a Berkovitch type diamond tip the load is applied to the surface while constantly monitoring the penetration depth of the tip. From the loading and unloading curves nanomechanical properties can be extracted. Since the whole tip assembly is attached to a XYZ piezo tube, nanometer scale positioning of the indent point is easily achieved. The position repeatability is 10 nm. The same diamond tip can also be used to obtain an AFM image of the surface and with the point and click user interface, the indent positions can be specified from the AFM image. Using the lateral transducer, force can be applied laterally and scratch tests can be performed. Our system is also designed to work with the Dynamic Mechanical Analysis (DMA) mode. This mode of operation allows us to measure the Viscoelastic constants of soft materials.
 Kyriaki Kalaitziou (Postdoctoral Fellow) performing a Scratch experiment on a Polymer Sample
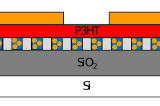
Measuring Hardness and Elastic Modulus of Mesoporous Silica Thin films
| Figure 1. Force vs. displacement curves for load-controlled indents on Mesoporous Silica Thin films of increasing cross link density due to different Siliane precursors. Sample 1, Sample 2, and Sample 3 with specified peak loads of 40 μN, 40 μN, and 150 uN, respectively. Peak loads were chosen so that the peak displacement of all indents would not exceed approximately 80 nm, 10% of the 800 nm silica film thickness. | Figure 2. Hardness and reduced modulus data plots with standard deviation bars from load-controlled indents on Sample 1, Sample 2, and Sample 3 with specified peak loads of 40 μN, 40 μN, and 150 uN, respectively. |
| Sample | Reduced Modulus (GPa) | Hardness (GPa) |
Hardness Normalized to TEOS |
| 1. Low Cross link | 4.19 ± 0.11 | 0.18 ± 0.004 | 1.00 |
| 2. Medium Cross link | 4.69 ± 0.19 | 0.47 ± 0.03 | 2.61 |
| 3. High Cross Link | 15.64 ± 3.1 | 1.23 ± 0.4 | 6.83 |
Table 1. Hardness and reduced modulus data from load-controlled indents on Samples 1, and 3 with specified peak loads of 40 μN, 40 μN, and 150 uN, respectively. The standard deviations of the hardness and modulus values found for Sample 3 are relatively high due to the surface roughness of the sample as shown in the AFM images in Fig.3.  Figure 3. AFM images of Samples 1,2 and 3 taken with the Nanoindenter tip itself. Indented positions are shown as green circles for Sample-3.